
FeatureVisu is a structure analysis and measurement tool for software product lines. This website provides access to the tool, background information, as well as data and supplementary material of an empirical study on forty software product lines of different sizes and domains conducted with FeatureVisu. The website is also meant as a supplementary website for the ICSE'11 paper "Feature Cohesion in Software Product Lines—An Exploratory Study".
FeatureVisu is an extension of the general-purpose visual-clustering tool CCVisu. Visual clustering and CCVisu can be used to decompose software graphs into subsystems, which aids program comprehension by visualizing the software design based on distances in the clustering layout. A detailed description of the clustering algorithm is available on CCVisu's website. FeatureVisu extends CCVisu by support for features. It expects as input the reference graph of a product line as well as a mapping between program elements and features (in relational standard format---RSF). This way, FeatureVisu abstracts from concrete product-line implementation techniques such as annotative approaches (e.g., the C preprocessor) and compositional approaches (e.g., feature-oriented programming). FeatureVisu supports all kinds of user interactions, for example, to adjust the number of iterations, change a feature's color, display edges and node names, all inherited from CCVisu. More information on FeatureVisu and its application is available in the accompanying ICSE'11 paper.
FeatureVisu is shipped with a number of examples as well as various scripts to visualize, explore, and measure the structure of product lines. File layout.sh is the central script. It is located in FeatureVisu/exp/scripts and can be used to cluster and visualize the structure of a product line:
-v states that, beside method or function invocations, also field accesses are considered during clustering. Command-line option -f is used to define the target .rsf file. The sample product lines of our empirical study are contained as examples in the distribution of FeatureVisu. The corresponding input data are in the directories FeatureVisu/exp/RSF (reference graph and feature mapping) and FeatureVisu/exp/XML (references). The script expects only the path to the .features.rsf file of directory FeatureVisu/exp/RSF.
In this example, the layout of the product line Bali2Jak is clustered and displayed as follows:
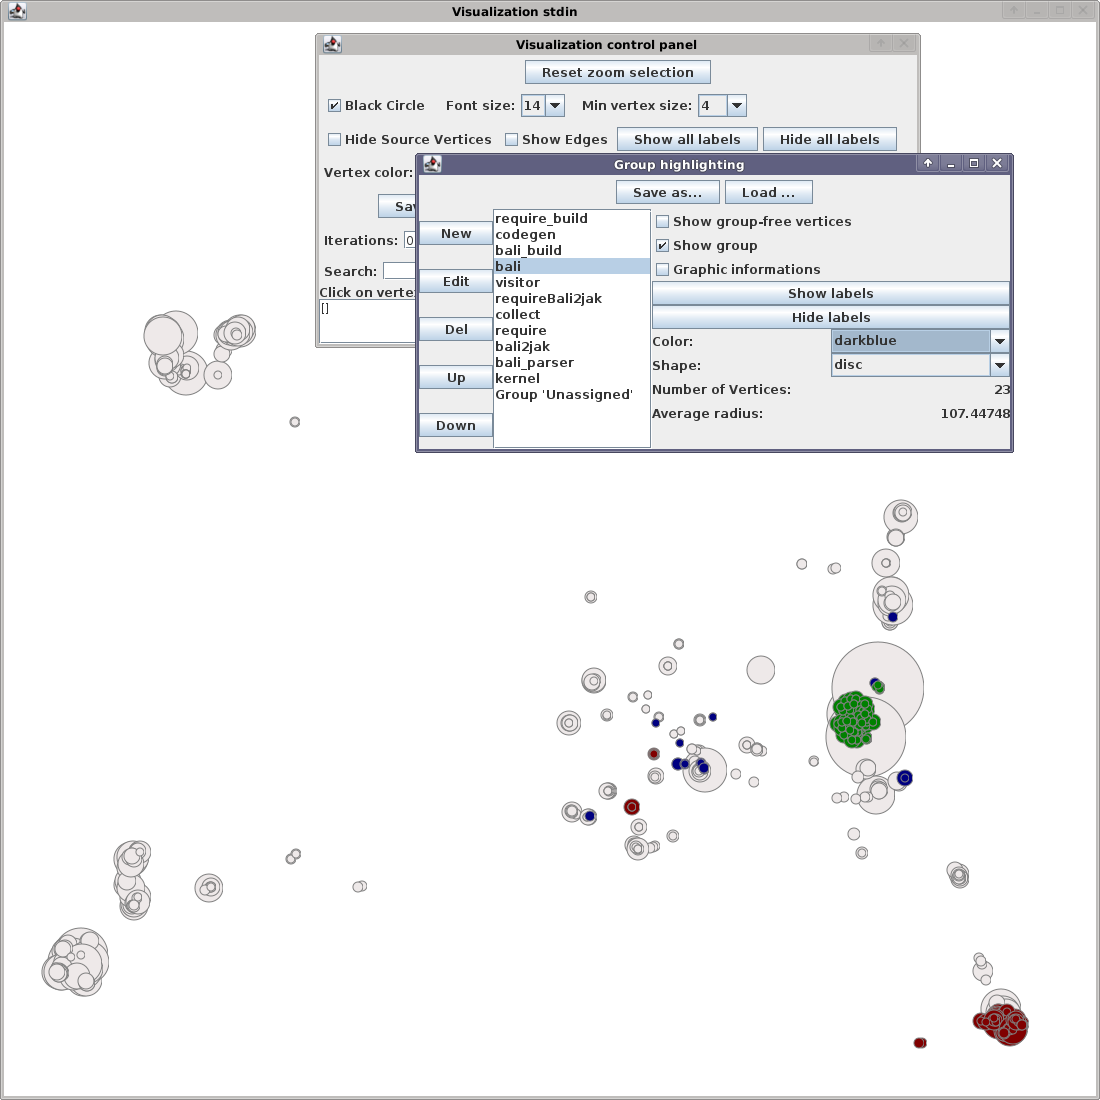
Using the group management facilities of FeatureVisu, we have highlighted the vertices of some features with colors.
The layout.sh script can also be used to start FeatureVisu in batch mode (using -b) printing only some statistics and measurements:
We conducted an empirical study (of which we report in our ICSE'11 paper) on forty software product lines of different sizes and domains. Here, we provide some supplementary material allowing other researchers to replicate our results.